Building a PUBG Stats Website
An in-depth retrospective of my solo-built stats website for PUBG that scaled to handle 32 million users.
Introduction
PLAYERUNKNOWN'S BATTLEGROUNDS (PUBG) is an online multiplayer video game that released as early access in March 2017. It was quickly gaining popularity and I was having a bunch of fun playing it with friends!
The game had a growing competitive community, and competitive players sure love stats. But, the main menu of the game was very slow, buggy and hard to read. The main issues I noticed were:
- You couldn't search a player's name to see their stats
- You could only access stats in the game
- There wasn't an overview page, you could only view a specific region/game mode combination at one time
The in-game stats page looked like this:
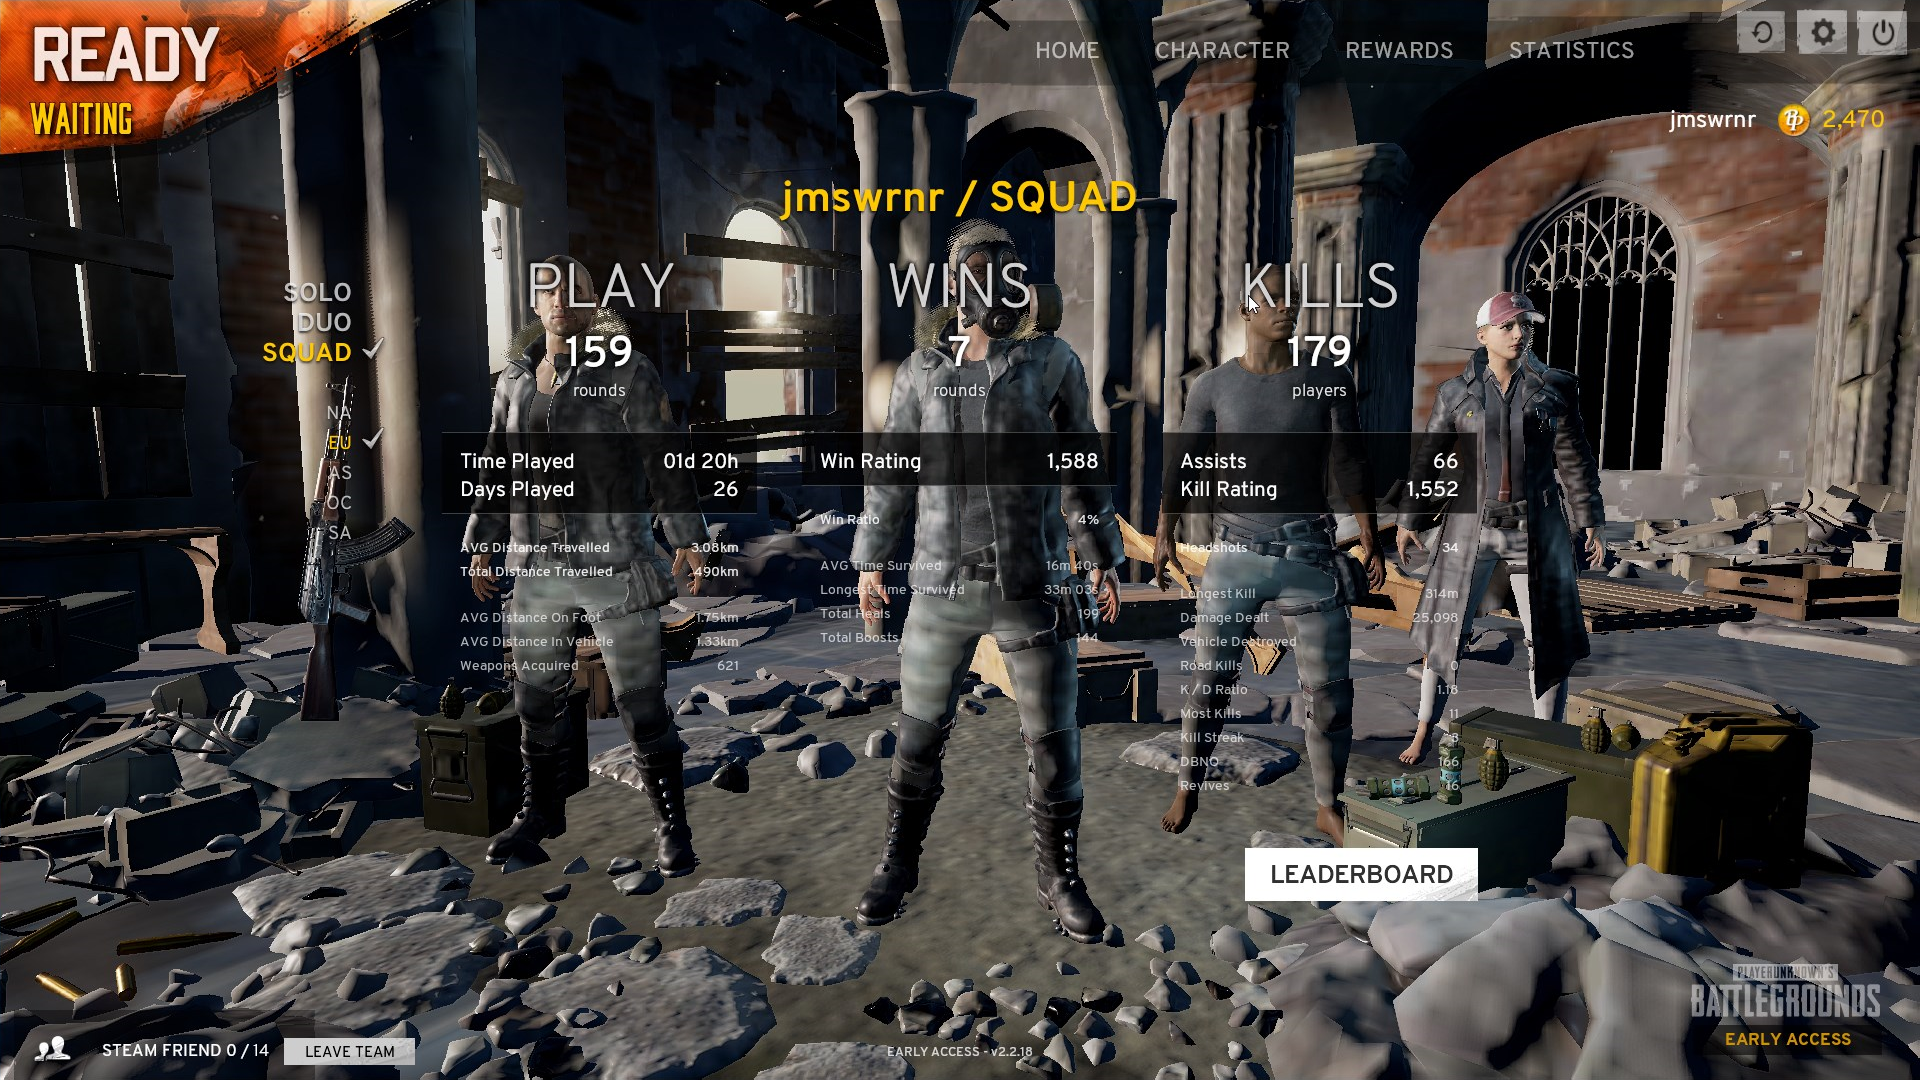
Community-made discord servers were starting to appear, designed to help players find teammates. But you couldn't see the ranks for these other players unless they shared a screenshot of their stats. There was no sign of an official website for stats. So I was curious, could I build a tool to help players lookup and share stats?
Reverse Engineering
There was no sign of a documented API for player stats. So, I decided to poke around PUBG to see where the stats were coming from. I noticed the main menu of the game was a static webpage loading from an AWS S3 bucket.
The menu would request player stats over a WebSocket connection. Luckily, the packets contained JSON-encapsulated data, so it wasn't difficult to parse. I noticed my account ID was a parameter for the stats fetching query, I tried changing it to my friend's ID and it worked!
I now knew it was possible to build a website to automate this process and serve player stats!
{
  "Rating": 1944,
  "BestRating": 1908.4,
  "RoundsPlayed": 111,
  "TimeSurvived": 127019.4,
  "LongestTimeSurvived": 1965.748,
  "WinPoints": 1637,
  "DailyWins": 0,
  "WeeklyWins": 0,
  "Wins": 1,
  "Top10s": 25,
  "Losses": 110
  // And a lot more...
}
But, the PUBG WebSocket API would only allow a connection if you provided a token to prove game ownership. PUBG's game client would request this token from Steam's internals. This process wasn't straightforward and the token didn't follow a public standard. This complexity prevented other developers from creating a similar website at first.
I was able to generate this token using the steam-user module. I requested a GameConnectToken and an AppOwnershipTicket. This data was then serialized into the custom token format that was reverse-engineered. This would not bypass any security but would allow me to prove ownership of the game. So, I could then automate querying data from the PUBG WebSocket API.
Picking a Name
Before building an MVP, I thought it was important to think of a nice domain name.
The domain needed to be short and trust-worthy. Players could be sharing their profile over direct-messages, social networks, and Twitch chatbots. Players could also mention the website on their live stream or over voice-chat. So, it also had to be easy to say and understand.
PLAYERUNKNOWN'S BATTLEGROUNDS was a long name. It's no surprise that the majority of players started to use the acronym "PUBG" instead. Because of this, I decided to see what domain names were available using this acronym.
After lots of brainstorming, I arrived at the name "pubg.me". It was short, it was easy to remember, it rhymed and the ".me" represented sharing something about you.
Unfortunately, after I shut down the website I lost control of the domain "pubg.me" due to a renewal error. I don't recommend visiting the domain as it's no longer in my control.
Minimum Viable Product
It was time to build an MVP to see if players wanted a website for stats. I decided to use:
- Heroku - Cloud Application Platform
- Node.js - JavaScript Server Runtime
- Keystone.js - CMS & Web App Framework
- Pug.js - HTML Templating Language
- Sass - Stylesheet Language
- Bootstrap - Style Framework
- jQuery - Front-end JavaScript Library
- MongoDB - NoSQL Database
- Mongoose - Object Modeling
- Google Analytics - Web Analytics Service
After a few days of coding and a lot of caffeine. I was able to hack together a simple website that solved the biggest problem at the time.
You could now enter a PUBG username to see the player's stats on a webpage. A page that you can share and access outside of the game's unpleasant menu:
I started by recreating the detailed stats pages which were available in-game. These pages allowed the user to view a specific region/game mode combination. Such as the player's stats for Europe/Solo, Asia/Duo or North America/Squad.
But there was a major UX issue here. Because there were 3 game modes and 5 regions, every player had 15 pages of stats. Not only would you need to figure out which region they played on, but also which game modes they played. What if they only played duo games on Europe servers? would you have to check every combination to find this out?
I solved this issue by creating an overview page. This page collates the most important data from all game modes for a specific region. For example, you could now view a Europe/Overview page. The majority of players would only play on a single region's server. So, there was no need to overcomplicate things by combining region data. To further improve UX, I also checked which region the player had most matches on so I could default to that view.
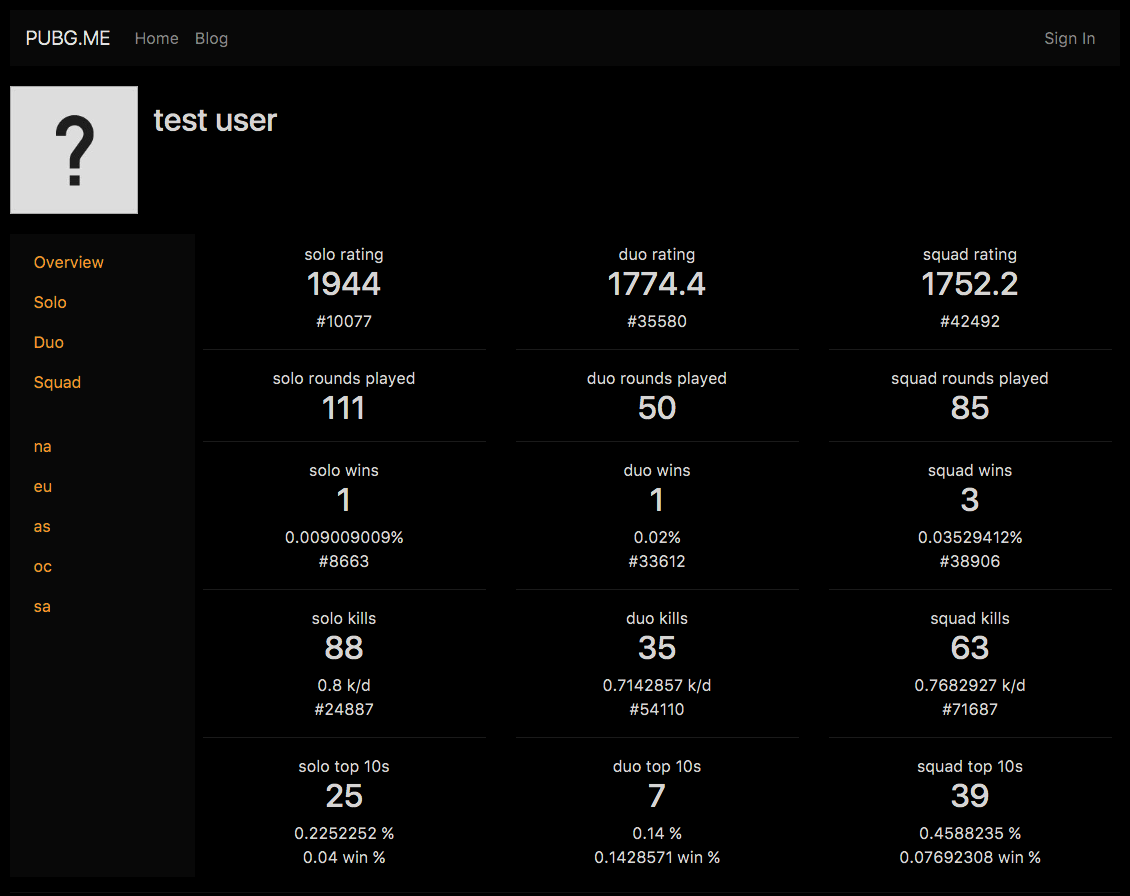
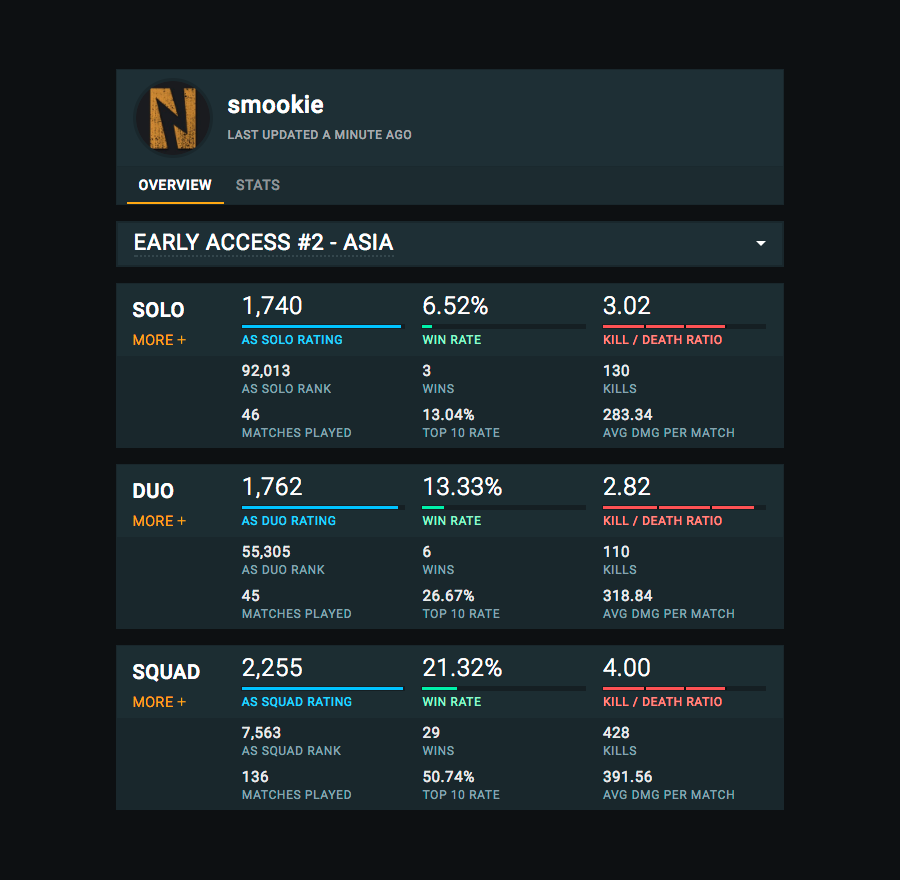
Now, by entering a player's username. You could see an overview of their stats for the region they played on the most.
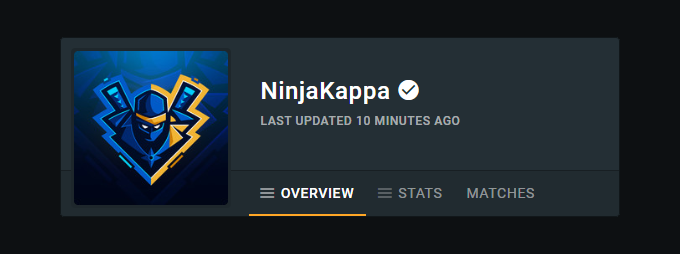
I added a very basic design so it looked more like a branded website instead of a bootstrap demo. And included the player's steam avatar so the page was more personal:
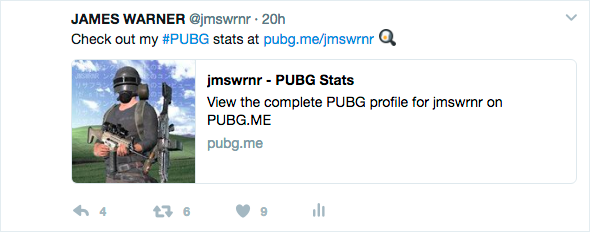
I knew players would be sharing a link to their stats page. So, I decided to add Twitter and Open Graph <meta> tags to it. Now, instead only seeing of a boring text link:

It would include a large clickable area with the player's steam avatar:
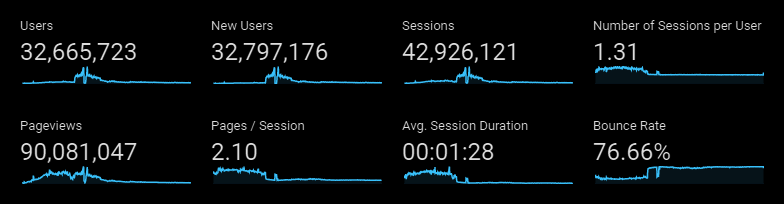
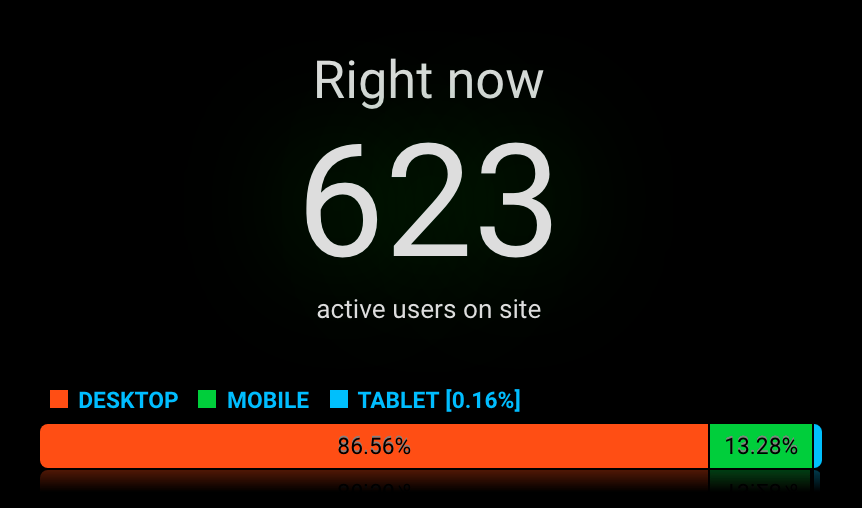
4 days after going live, the website analytics were looking very promising:
Preparing for Scale
It was clear the PUBG community wanted a website for stats. The game was continuing to grow at an unexpected rate. Players that cared about stats gave up on the game's main menu and used the website instead.
It was time to optimize for scale.
For the MVP, I used a single WebSocket connection in the Node.js backend. After fetching stats from this connection, it would store the data in MongoDB. And would only fetch new stats if the MongoDB data had reached a certain age.
Having everything running on a single back-end instance was a bad idea. I decided to split the WebSocket connection into a worker server. I could now create more workers as I needed more data, without scaling the page rendering servers too.
I also decided to remove Mongoose data modeling for game data. It added unnecessary bloat to the process of querying and rendering stats.
I now added Kue to the project, which is a priority job queue for Node.js backed by Redis. I used this queue to manage the status of fetching new stats across multiple Node.js instances.
When the page rendering server needed fresh data, it would add a job to the queue for that specific player. One of the worker servers would now pick up this job, fetch the latest stats for that player and update MongoDB. The page was now able to render using fresh data.
I then created Compound Indexes in MongoDB. I designed these indexes around the main queries used by the website. So, as the collection grew to millions of documents, it was still quick to sort and query the data. This was very useful for displaying up-to-date leaderboards.
Now the website was able to handle large amounts of users, it was time to work on growing the site. Player's were already spreading their profile links like wildfire. So, I started to focus my time on improving the user interface and experience.
Design Revamp
A player's profile page was the most visited page on the website. It was important to understand how this page was being used. Then I could optimize the design for better user experience.
It was clear that the user wanted to see the stats for a specific player. But, I needed to know exactly which stats were most important so I could focus on them in the design. I checked out community discord servers to see which stats most players were using. I then discussed it with professional players and tournament organizers.
After my research, I found there were only a few stats of interest:
- Elo Rating
- Rank (Leaderboard position of rating)
- Kill / Death Ratio
- Average Damage / Match
I had to design the player overview page so the user could read these specific stats for each game mode. Without getting delayed by unimportant stats.
To make things more complicated. PUBG had planned to start a new season, which involved resetting all player stats. I decided to prepare for this by adding a filter to change the season in combination with the region.
A user would rarely need to change this filter, unless looking at old data or a secondary region. So, it should be an opt-in interaction that defaulted to the most common use-case. It would default to the player's most active region during the latest season.
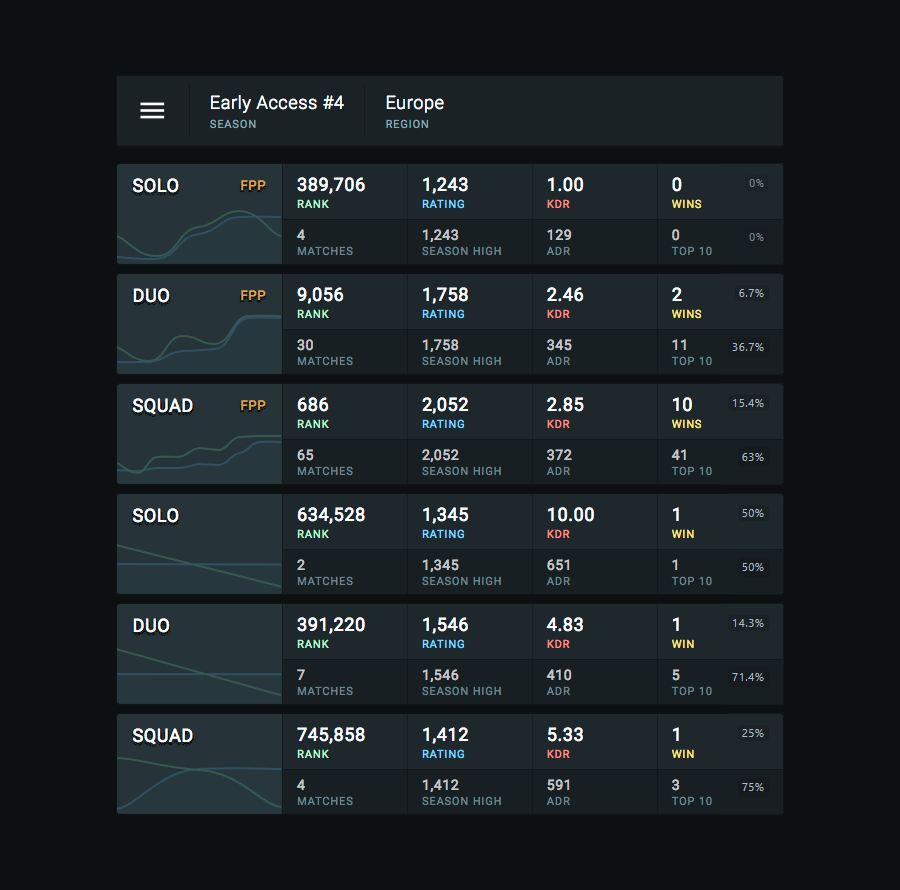
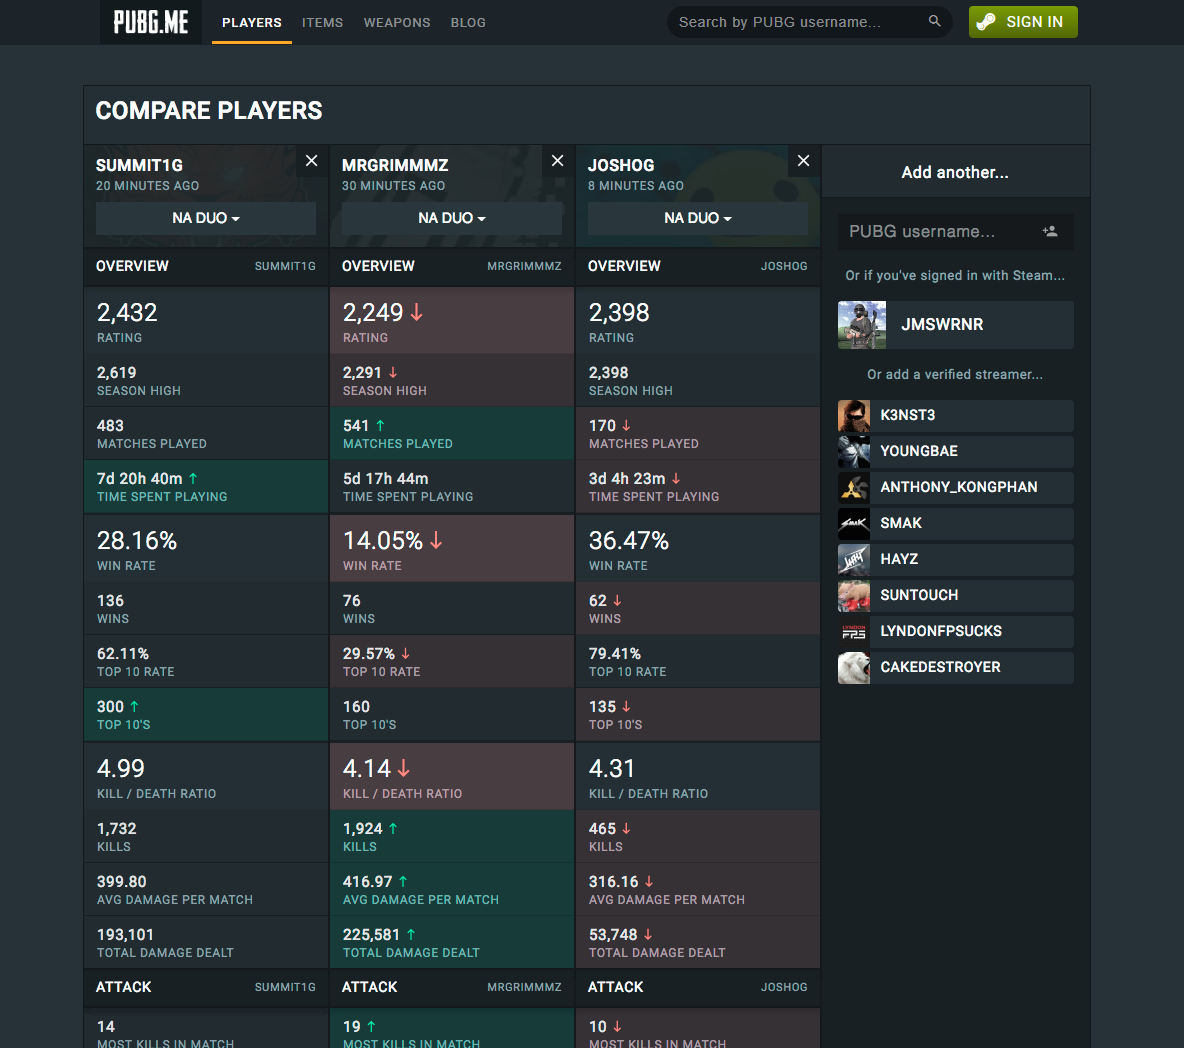
I also heard about an alternative for every game mode in the works, which now doubles the amount of stats. So, I decided to switch the layout so each game mode was now a column containing the most important stats:
This was much better. But, when the game adds more game modes, the user would need to scroll down to see these important stats.
Each match had 100 players and only 1-4 winners. This made the number of wins a stat to be proud of. I decided to focus on this stat instead of the win rate percentage. If a user was happier with their stats, it would increase the chances of the user wanting to share their stats page.
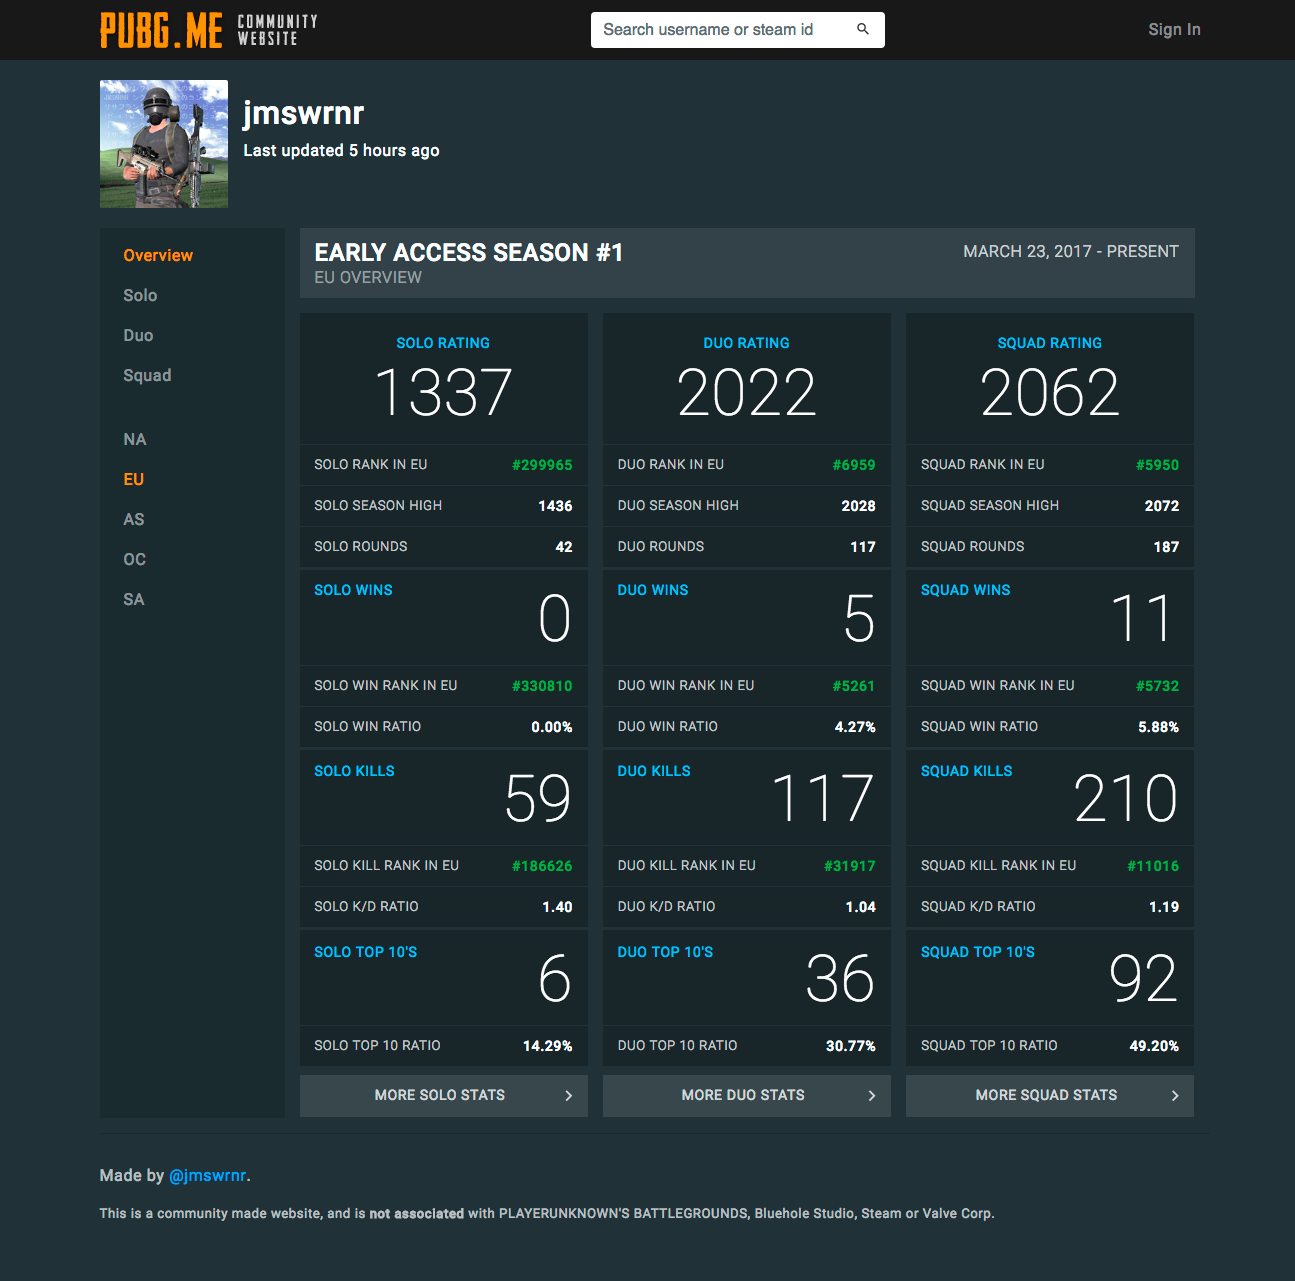
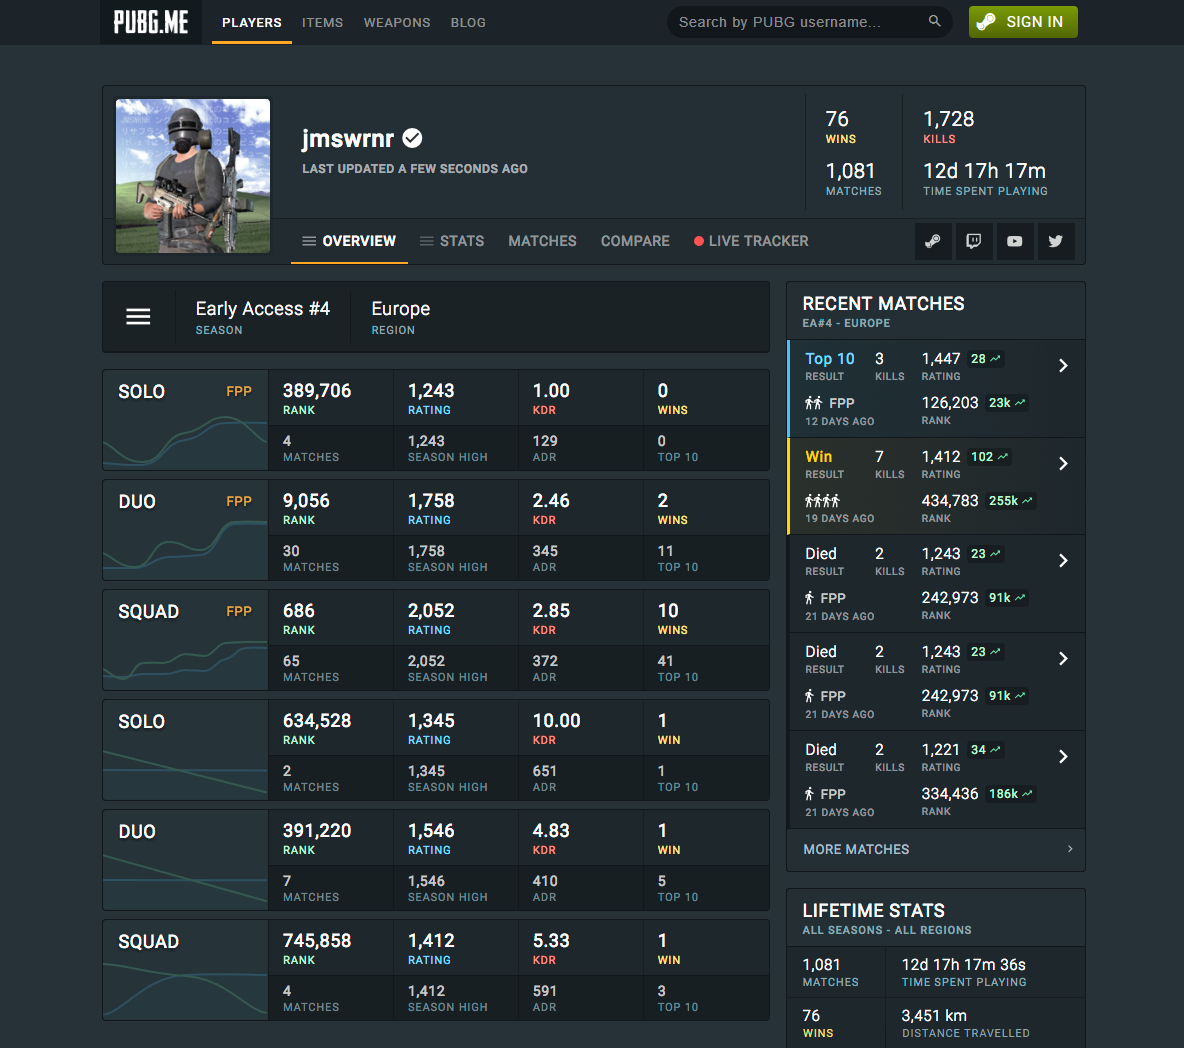
I reduced the height of each column by removing some stats. I also tweaked the colors and added a stat history chart. The result was a clean, compact overview which made it much easier to read the important stats for a player:
Tracking Matches
Some of the top players were tracking their stats by hand to see how each match affected their Elo rating. They wanted to rank up as fast as possible to make it to the top of the leaderboards.
The WebSocket API didn't expose data for specific matches, only the total stats for a player. But that got me thinking, the overall stats included a RoundsPlayed value.
If the RoundsPlayed value had increased by 1 since the last stats fetch, they had since played a single match. So, we knew that any other change to the player's stats would be the result of this single match. We could now determine whether they had won the match, how many kills they got, and how it affected their Elo rating!
Using this data, I added a list of the player's recent matches to the sidebar of the overview page:
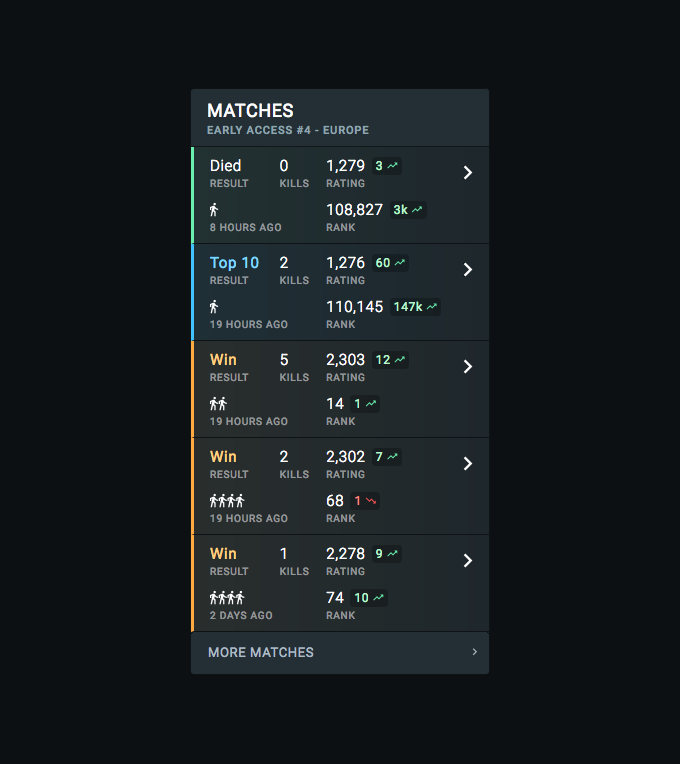
Each match would have an accent color based on its outcome:
- A win would show gold
- A top 10 placement would show blue
- A loss but ranking up would show green
- A loss and ranking down would show red
When a player wins a match, it's usually a big deal! They want to share the news because it's rarely achieved by the average player. I decided to make this a little easier. If they had recently won a match. I displayed a prompt to share the match stats to social networks:
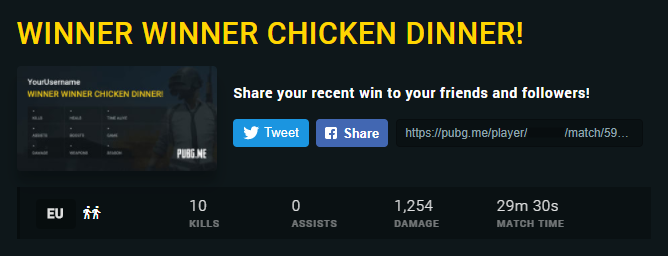
This would add a generated image to the social post which showed the stats of the match. And when clicked, the image would open the website to show more stats:
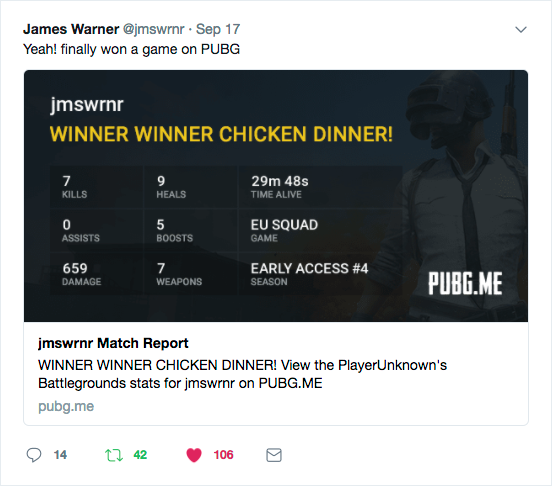
I generated this image using Cloudinary, which is a service to optimize, transform and deliver images at scale. I first designed and uploaded the background template without any text to Cloudinary. Then using the Image Transformations feature I was able to overlay the text. By defining the text values, positions, color, and font in the URL.
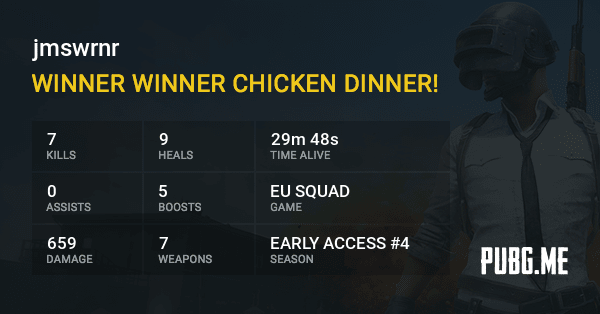
This constructed URL would go into the social <meta> tags on a page specific to that match. Cloudinary would only generate this image when something requests it. And social networks would only request the image as the match was being shared!
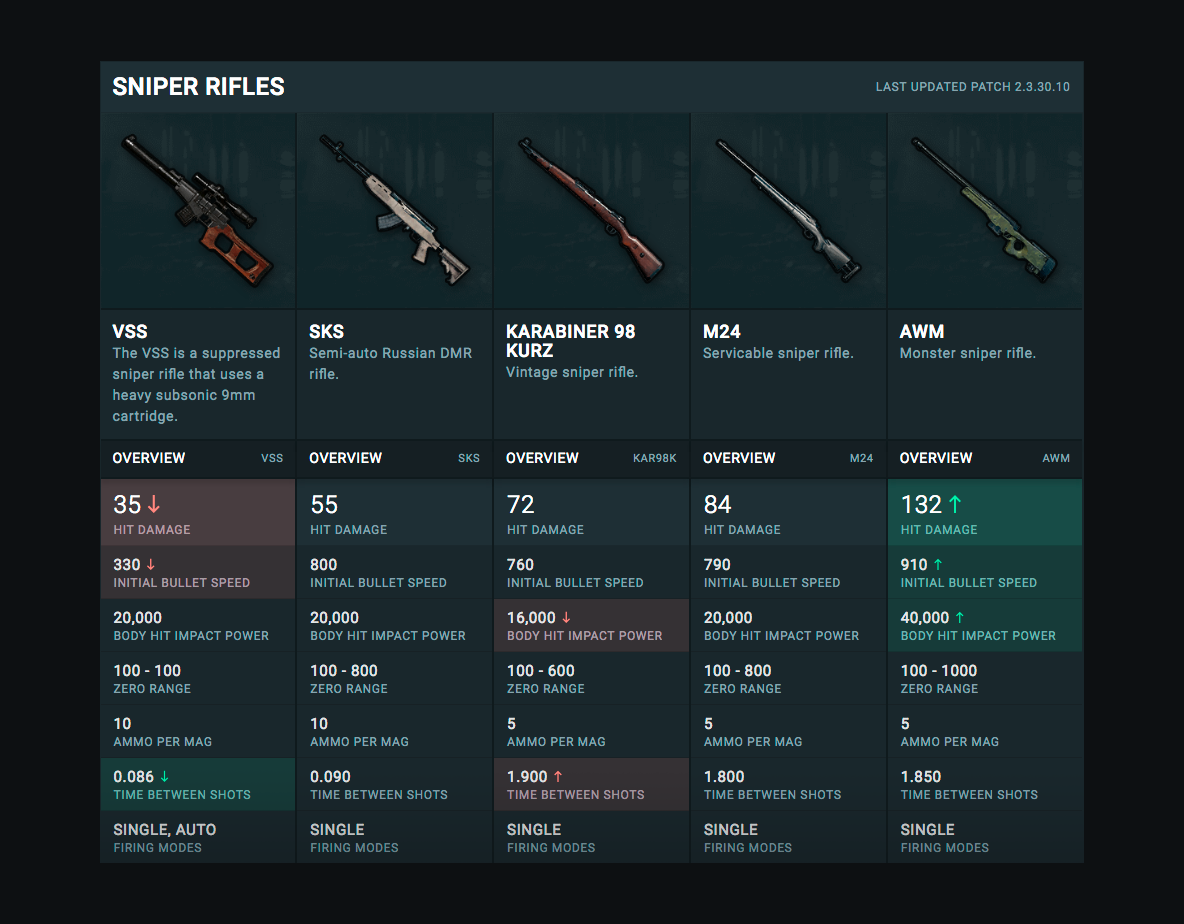
Data Mining
I noticed players were comparing the game's weapons by hand. In an attempt to determine the weapon's damage and effective range. This gave me the idea of creating an automated process to extract weapons stats from the game.
I was able to make a custom tool to achieve this. It dumped all the stats from the game's memory using reverse-engineered data structures. Using this data, I generated a static webpage that would display a comparison of all the weapons.
This managed to get a lot of new users onto the website because I was the first to publish this data:
Verified Checkmark
The verified checkmark is a powerful thing on social networks. It's there to help identify the legitimate account for those who would need it. But it's also interpreted as a sign of accomplishment, importance, and value from the platform.
The game was very popular across live-streaming platforms. Most of the top gaming streamers were streaming it.
I decided to add a feature to the website so I could verify players and give them a nice checkmark on their page. I would verify any player that streamed PUBG who had a verified Twitch or Twitter account. This made the manual verification process very quick.
I then added a leaderboard of verified players. Sorted by total matches played during that current season. I also added buttons to their live stream and social accounts.
This wasn't only to help users identify the stats for legitimate streamers. But also to show that the website valued the streamers as important players.
Streamers soon started to share their stats page more often. Both on social networks and their live stream. Not only to show their stats to their fans but also to imply they were worth watching because of that checkmark.
Search Engine Optimization
The SEO strategy wasn't too complex. I focused on:
- Detailed
<meta>tags - Writing unique blog content
- Social sharing
- Organic backlinks
I had designed the website around users sharing a link to their stats page. This created many high-quality organic backlinks across social networks, websites, blogs, and forums.
I added a Blog to the website where I wrote unique content. This content included game guides, analysis of game updates and new website features.
I included <meta> tags for Twitter Cards, Open Graph, and JSON-LD Structured Data. These tags were especially great for blog posts. They ensured Google displayed the correct data when featuring the posts.
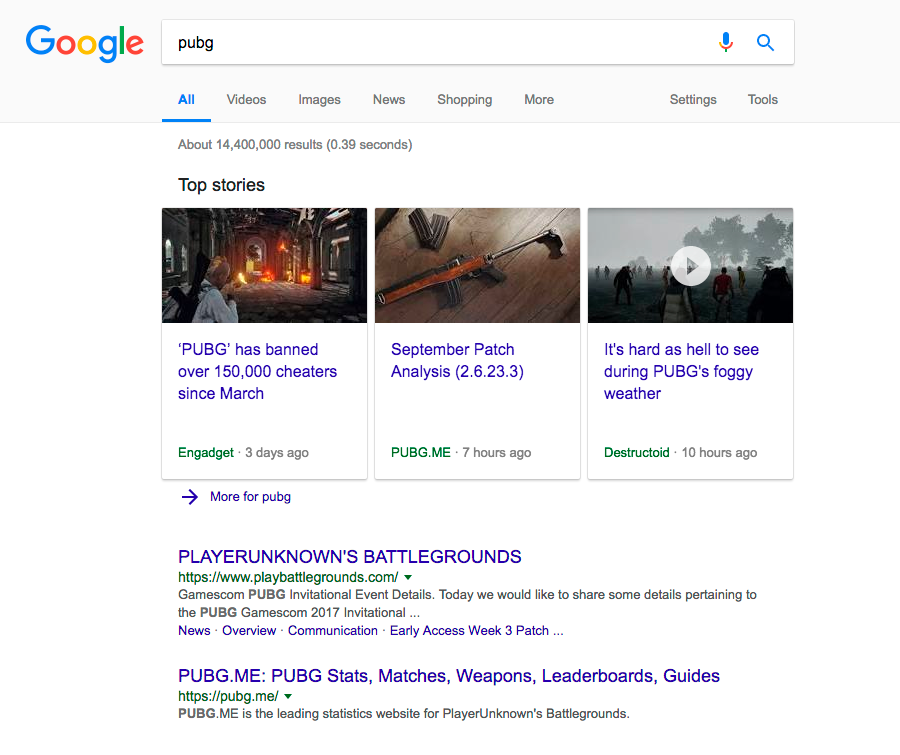
This strategy proved to work very well. Google featured most of the blog posts I wrote. And the website usually showed in second place for the search term "pubg", after the actual game itself:
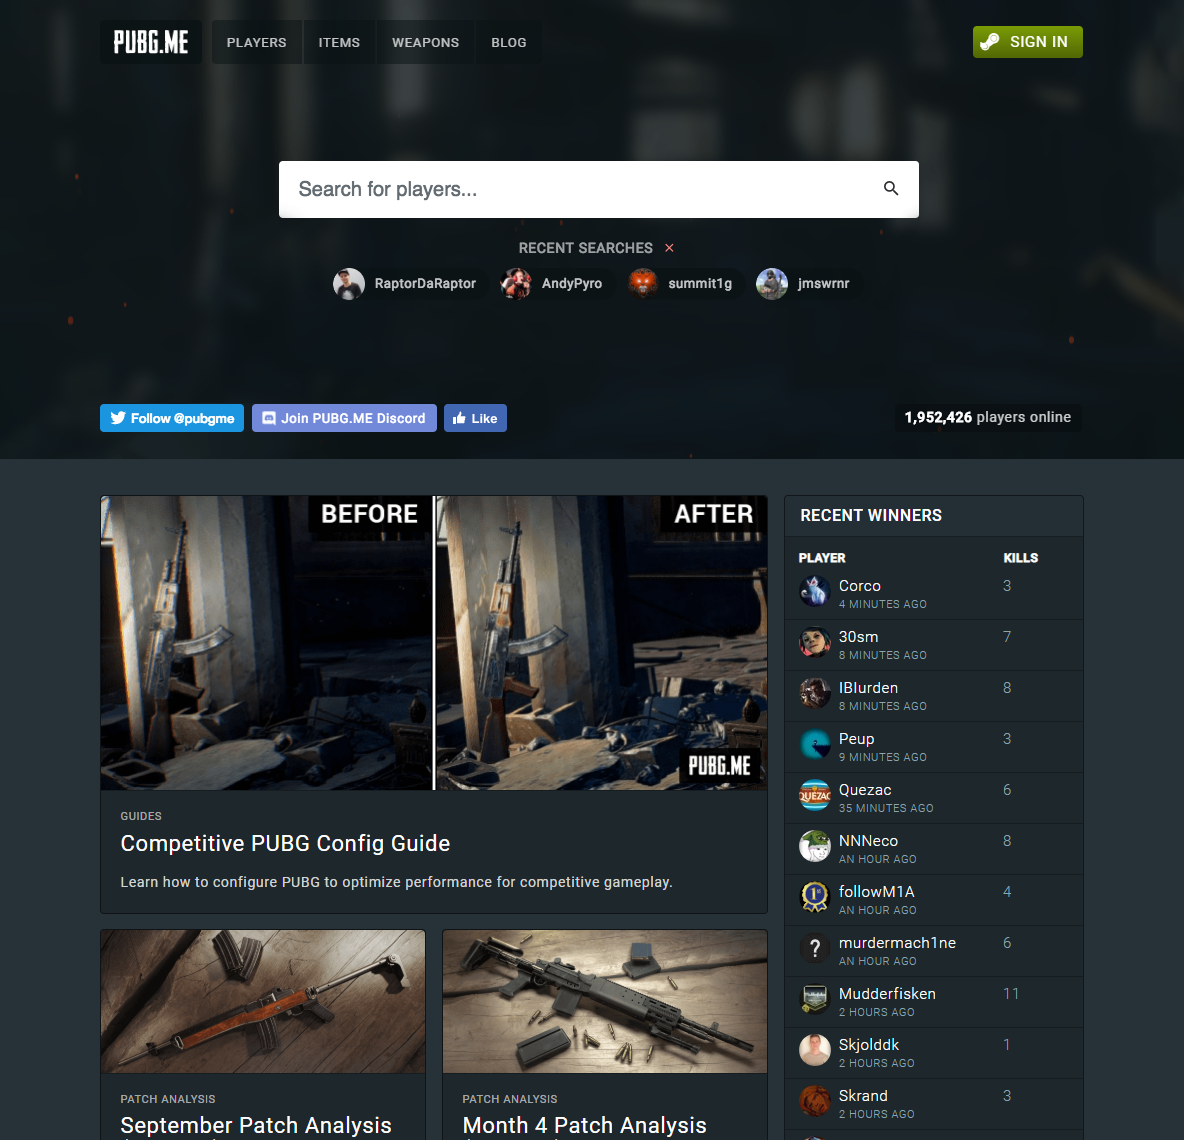
Final Design
The website went through many design changes. Here are some images of the final version.
Conclusion
Working on this project was great fun. I've learned a lot throughout its development.
Building a large-scale, full-stack website completely solo was very beneficial. It allowed me to better understand the architecture and best practices when working at scale. It also allowed me to experiment with marketing ideas that would be harder to test without a large audience.
During the 18 months that it was online, the website managed to reach an impressive amount of users. It's awesome knowing that I created something that millions of people wanted to use: